|
Sino Biological
murine recombinant negr1 Murine Recombinant Negr1, supplied by Sino Biological, used in various techniques. Bioz Stars score: 96/100, based on 1 PubMed citations. ZERO BIAS - scores, article reviews, protocol conditions and more https://www.bioz.com/product/elisa+negr1+protein+levels/Recombinant+Protein+A/pm36433953-296-13-16 Average 96 stars, based on 1 article reviews
murine recombinant negr1 - by Bioz Stars,
2026-09
96/100 stars
|
Buy from Supplier |
|
MedChemExpress
hy p76508 sap recombinant protein mce Hy P76508 Sap Recombinant Protein Mce, supplied by MedChemExpress, used in various techniques. Bioz Stars score: 93/100, based on 1 PubMed citations. ZERO BIAS - scores, article reviews, protocol conditions and more https://www.bioz.com/product/elisa+negr1+protein+levels/NEGR1%2C+Human/pm40713952-1147-57-61 Average 93 stars, based on 1 article reviews
hy p76508 sap recombinant protein mce - by Bioz Stars,
2026-09
93/100 stars
|
Buy from Supplier |
|
Proteintech
anti negr1 Anti Negr1, supplied by Proteintech, used in various techniques. Bioz Stars score: 94/100, based on 1 PubMed citations. ZERO BIAS - scores, article reviews, protocol conditions and more https://www.bioz.com/product/elisa+negr1+protein+levels/NEGR1+Antibody/pmc12783301-247-64-65 Average 94 stars, based on 1 article reviews
anti negr1 - by Bioz Stars,
2026-09
94/100 stars
|
Buy from Supplier |
|
Santa Cruz Biotechnology
goat polyclonal antibodies against negr1 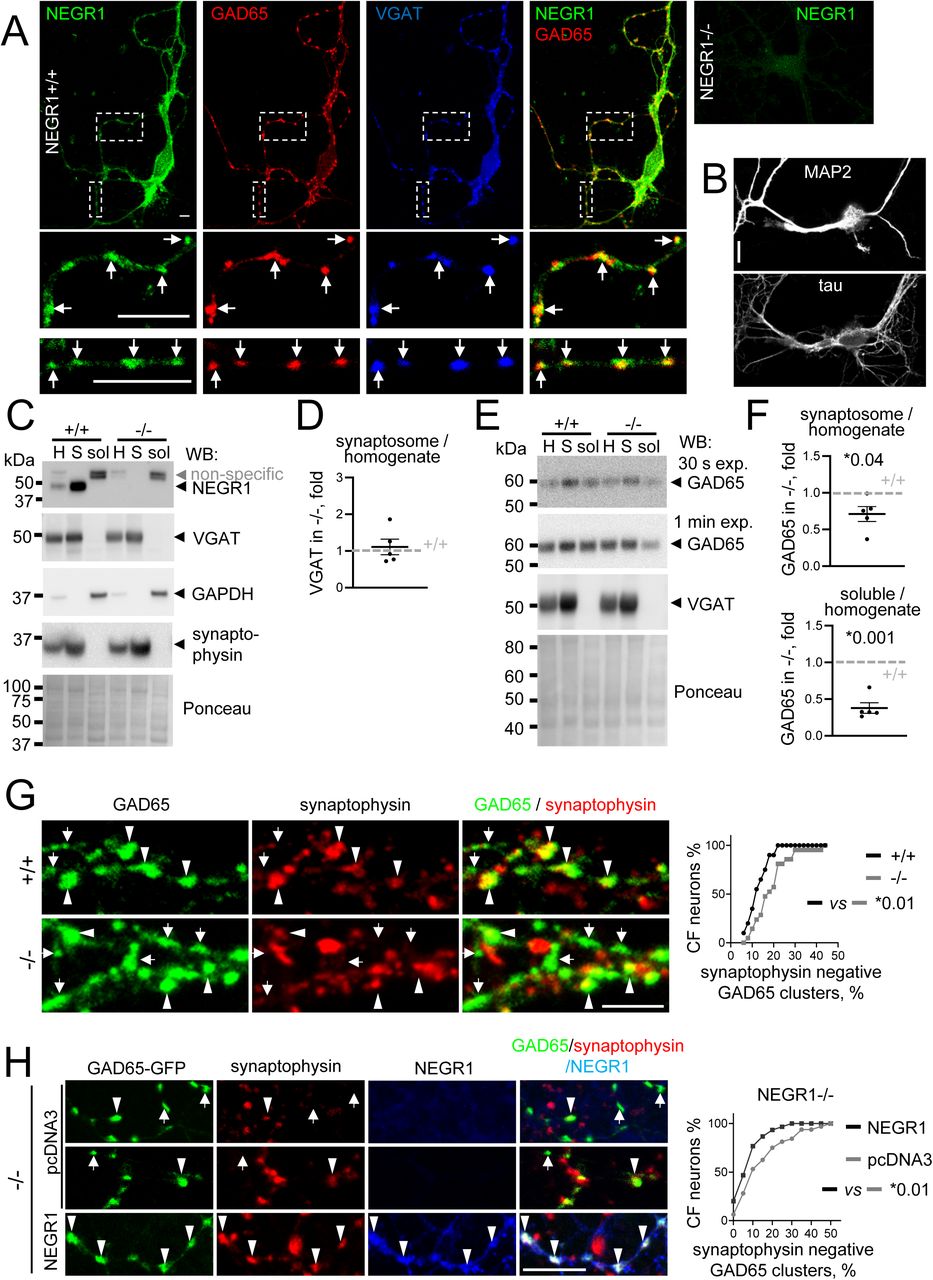 Goat Polyclonal Antibodies Against Negr1, supplied by Santa Cruz Biotechnology, used in various techniques. Bioz Stars score: 93/100, based on 1 PubMed citations. ZERO BIAS - scores, article reviews, protocol conditions and more https://www.bioz.com/product/elisa+negr1+protein+levels/NEGR1+Antibody/bio_rxiv__2022__02__08__479601-204-0-61 Average 93 stars, based on 1 article reviews
goat polyclonal antibodies against negr1 - by Bioz Stars,
2026-09
93/100 stars
|
Buy from Supplier |
|
Boster Bio
negr1  Negr1, supplied by Boster Bio, used in various techniques. Bioz Stars score: 93/100, based on 1 PubMed citations. ZERO BIAS - scores, article reviews, protocol conditions and more https://www.bioz.com/product/elisa+negr1+protein+levels/Anti-NEGR1+Antibody+Picoband/pmc11682457-87-54-56 Average 93 stars, based on 1 article reviews
negr1 - by Bioz Stars,
2026-09
93/100 stars
|
Buy from Supplier |
|
R&D Systems
goat polyclonal antibodies against negr1 Goat Polyclonal Antibodies Against Negr1, supplied by R&D Systems, used in various techniques. Bioz Stars score: 93/100, based on 1 PubMed citations. ZERO BIAS - scores, article reviews, protocol conditions and more https://www.bioz.com/product/elisa+negr1+protein+levels/Human%2FMouse+Kilon%2FNEGR1+Antibody/bio_rxiv__2022__02__08__479601-202-0-17 Average 93 stars, based on 1 article reviews
goat polyclonal antibodies against negr1 - by Bioz Stars,
2026-09
93/100 stars
|
Buy from Supplier |
|
23andMe
negr1 protein Negr1 Protein, supplied by 23andMe, used in various techniques. Bioz Stars score: 90/100, based on 1 PubMed citations. ZERO BIAS - scores, article reviews, protocol conditions and more https://www.bioz.com/product/elisa+negr1+protein+levels/negr1+protein/pmc07116257-127-14-4 Average 90 stars, based on 1 article reviews
negr1 protein - by Bioz Stars,
2026-09
90/100 stars
|
Buy from Supplier |
|
Elabscience Biotechnology
negr1 protein levels Negr1 Protein Levels, supplied by Elabscience Biotechnology, used in various techniques. Bioz Stars score: 92/100, based on 1 PubMed citations. ZERO BIAS - scores, article reviews, protocol conditions and more https://www.bioz.com/product/elisa+negr1+protein+levels/Recombinant+Human+NEGR1+Protein/ppr0933636-80-2-18 Average 92 stars, based on 1 article reviews
negr1 protein levels - by Bioz Stars,
2026-09
92/100 stars
|
Buy from Supplier |
|
Human Protein Atlas
negr1 protein expression summary Negr1 Protein Expression Summary, supplied by Human Protein Atlas, used in various techniques. Bioz Stars score: 86/100, based on 1 PubMed citations. ZERO BIAS - scores, article reviews, protocol conditions and more https://www.bioz.com/product/elisa+negr1+protein+levels/23+atlas+expression+human+mat2a+protein+protein+summary+the/pm41588420-435-0-5 Average 86 stars, based on 1 article reviews
negr1 protein expression summary - by Bioz Stars,
2026-09
86/100 stars
|
Buy from Supplier |
|
Rabbit anti-Human NEGR1 Polyclonal Antibody
|
Buy from Supplier |
|
Recombinant Chicken NEGR1 full length or partial length protein was expressed.http://www.creativebiomart.net/description_419581_12.htm
|
Buy from Supplier |
Image Search Results
Journal: bioRxiv
Article Title: Neuronal growth regulator 1 (NEGR1) promotes synaptic targeting of glutamic acid decarboxylase 65 (GAD65)
doi: 10.1101/2022.02.08.479601
Figure Lengend Snippet: (A) NEGR1+/+ cultured hypothalamic neuron immunolabelled for NEGR1, GAD65 and VGAT. Magnified images of the outlined areas show examples of NEGR1 clusters overlapping with GAD65 and VGAT accumulations (arrows). NEGR1-/- neurons were labelled for control. Bars, 10 µm. (B) NEGR1+/+ cultured hypothalamic neurons immunolabelled for a dendritic marker protein MAP2 and axonal marker protein tau. Bar, 20 µm. (C-F) Western blot (WB) analysis of VGAT ( C, D ) and GAD65 ( E, F ) in NEGR1+/+ and NEGR1-/- brain homogenates (H), synaptosomes (S) and soluble protein (sol) fractions. NEGR1 labelling was included in ( C ) to illustrate its enrichment in synaptosomes. Two different exposures of GAD65 labelling in ( E ) are shown to better illustrate a reduction in GAD65 levels in NEGR1-/- synaptosomes and soluble protein fractions. Labelling for GAPDH and Ponceau stain was used to control loading. Labelling for synaptophysin was used to confirm the efficiency of synaptosome isolation. Graphs show mean ± SEM changes in protein enrichment in NEGR1-/- synaptosomes and soluble protein fractions vs enrichment in NEGR1+/+ samples set to 1. n = 5 pairs of NEGR1+/+ and NEGR1-/- mice were analyzed. *p, one sample t test vs +/+. ( G ) NEGR1+/+ and NEGR1-/- cultured hypothalamic neurons immunolabeled for GAD65 and synaptophysin. ( H ) NEGR1-/- cultured hypothalamic neurons transfected with GAD65-GFP and pcDNA3 or NEGR1 immunolabelled for synaptophysin and NEGR1. In G , H , examples of synaptophysin positive (arrowheads) and negative (arrows) GAD65 clusters are shown. Bars, 5 µm. Graphs show cumulative frequency (CF) of neurons with different percentages of synaptophysin negative GAD65 clusters. *p, Mann-Whitney test (n = 20 ( G ) and 30 ( H ) neurons per group). Figure 1 source data. Contains uncropped Western blot source data for Figure 1.
Article Snippet:
Techniques: Cell Culture, Control, Marker, Western Blot, Staining, Isolation, Protein Enrichment, Immunolabeling, Transfection, MANN-WHITNEY
Journal: bioRxiv
Article Title: Neuronal growth regulator 1 (NEGR1) promotes synaptic targeting of glutamic acid decarboxylase 65 (GAD65)
doi: 10.1101/2022.02.08.479601
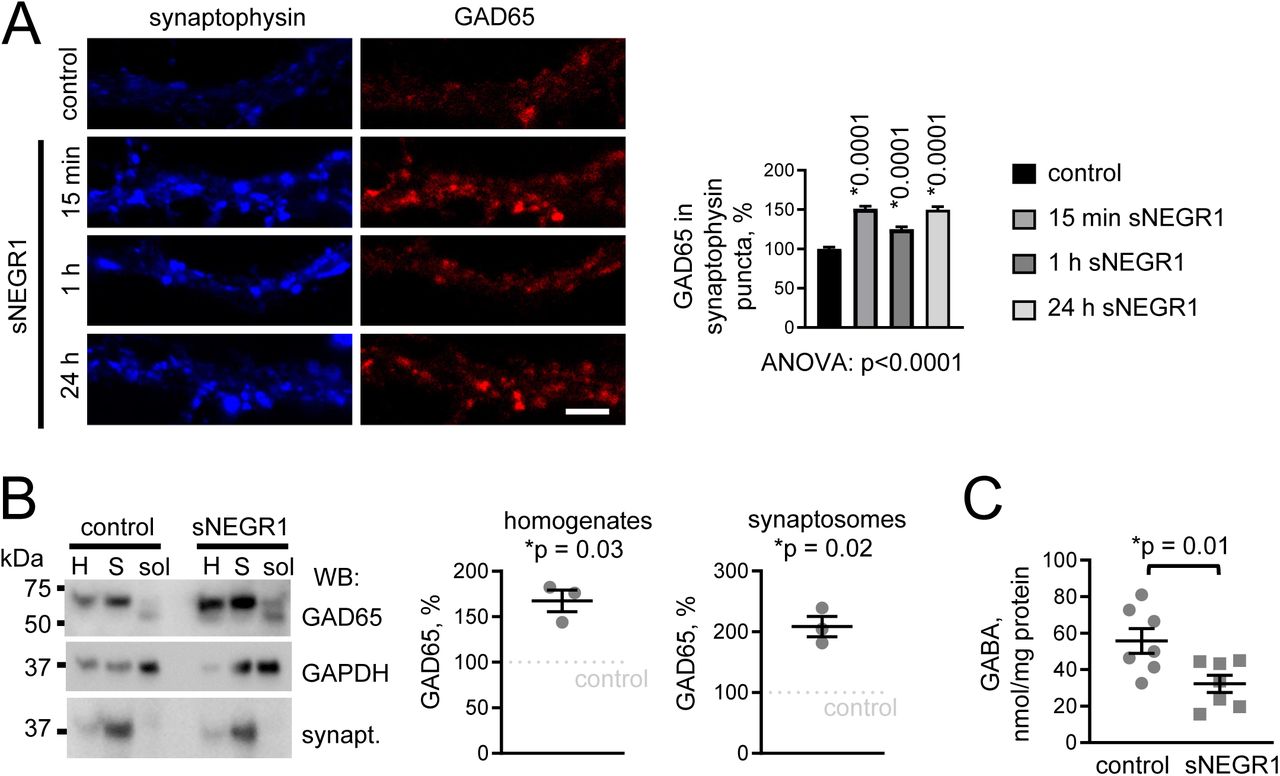
Figure Lengend Snippet: (A) NEGR1+/+ cultured hypothalamic neurons treated with recombinant soluble NEGR1 (sNEGR1) or mock-treated with the culture medium (control) immunolabeled for GAD65 and synaptophysin. Bar, 5 µm. Graph shows mean + SEM levels of GAD65 in synaptophysin accumulations relative to the mean value of the control set to 100% (n > 1000 boutons analyzed per group). *p, one-way ANOVA and Dunnett’s multiple comparisons test (compared to control). (B) Western blot (WB) analysis of GAD65 levels in homogenates (H), synaptosomes (S) and soluble protein fractions (sol) from hypothalamic tissues treated with BSA (control) or sNEGR1. GAPDH and synaptophysin served as loading controls. Graphs show mean ± SEM GAD65 levels in sNEGR1-treated tissues relative to GAD65 levels in the control set to 100% from n = 3 independent experiments. *p, one sample t test vs control. (C) Concentration of GABA in synaptosomes from hypothalamic tissues treated with BSA (control) or sNEGR1 (n = 7). *p, t test. Figure 2 source data. Contains uncropped Western blot source data for Figure 2.
Article Snippet:
Techniques: Cell Culture, Recombinant, Control, Immunolabeling, Western Blot, Concentration Assay

Journal: bioRxiv
Article Title: Neuronal growth regulator 1 (NEGR1) promotes synaptic targeting of glutamic acid decarboxylase 65 (GAD65)
doi: 10.1101/2022.02.08.479601
Figure Lengend Snippet: (A-D) Synaptic vesicles in cultured hypothalamic neurons were loaded with FM4-64 applied for 2 min in 47 mM K+ buffer (0 s). Time lapse images show release of the dye in response to the electric field stimulation. Bar, 5 μm. Graphs show FM4-64 uptake at 0 s, changes in FM4-64 levels (ΔF/F) in synaptic boutons over time during the stimulation, and half-life of FM4-64 loss during the stimulation (mean ± SEM, *p, Mann-Whitney test). (A) NEGR1+/+ neurons (n = 113 boutons from 10 neurons) and NEGR1-/- neurons (n = 108 boutons from 10 neurons). (B, C) NEGR1+/+ neurons co-transfected with GFP and pcDNA3 or NEGR1. Axons ( B, n = 418 boutons from 10 pcDNA3-transfected neurons, 266 boutons from 12 NEGR1-transfected neurons) and dendrites ( C , n = 376 boutons from 12 pcDNA3-transfected neurons, 261 boutons from 13 NEGR1- transfected neurons). (D) NEGR1+/+ neurons treated with control non-specific immunoglobulins (Ig, n = 681 boutons from 10 neurons) or NEGR1 antibodies (NEGR1 Ab, n = 514 boutons from 10 neurons).
Article Snippet:
Techniques: Cell Culture, MANN-WHITNEY, Transfection, Control

Journal: bioRxiv
Article Title: Neuronal growth regulator 1 (NEGR1) promotes synaptic targeting of glutamic acid decarboxylase 65 (GAD65)
doi: 10.1101/2022.02.08.479601
Figure Lengend Snippet: (A, B) NEGR1+/+ cultured hypothalamic neurons treated with sNEGR1 and dynasore ( A ) or TetTx ( B ) as indicated. Control neurons were mock treated with vehicle (DMSO in A , water in B ). Neurons were immunolabeled for GAD65 and synaptophysin. Examples of synaptophysin positive (arrows) and negative (arrowheads) GAD65 clusters are shown. Bars, 5 µm. Graphs show cumulative frequency (CF) of neurons with increasing percentages of synaptophysin negative GAD65 clusters. *p, Mann-Whitney test (n = 20-26 neurons per group). (C, D) sNEGR1-treated and control culture medium-treated NEGR1+/+ cultured hypothalamic neurons incubated live with antibodies against the lumenal domain of VGAT. The antibodies were detected with secondary antibodies applied before (VGAT surface_remaining ) and after (VGAT surface_delivered ) permeabilization of membranes with detergent. Neurons were co-labelled with antibodies against the cytoplasmic domain of VGAT (VGAT synaptic ). Bar, 5 μm. Graphs show mean + SEM labelling intensities of VGAT synaptic and VGAT surface_delivered ( C ), VGAT surface_remaining ( D ), and their ratios (n = 40 neurons in C , 20 neurons in D ). Control mean intensity was set to 100%. (E) Western blot analysis of GAD65 levels in synaptic PM from hypothalamic tissues treated with BSA or sNEGR1 applied either alone (cont.) or together with dynasore (dyn.) or TetTx. NCAM1 served as loading control. Graph shows mean ± SEM GAD65 levels relative to the levels in BSA only treated tissues set to 100% from n = 3 independent experiments. Samples from each experiment were analyzed by Western blot twice and the data were averaged. *p, one sample t test vs BSA only treated tissues. Figure 4 source data. Contains uncropped Western blot source data for Figure 4.
Article Snippet:
Techniques: Cell Culture, Control, Immunolabeling, MANN-WHITNEY, Incubation, Western Blot

Journal: bioRxiv
Article Title: Neuronal growth regulator 1 (NEGR1) promotes synaptic targeting of glutamic acid decarboxylase 65 (GAD65)
doi: 10.1101/2022.02.08.479601
Figure Lengend Snippet: (A) Diagram illustrating the principle of detection of the PM attachment of GAD65 using BiFC. (B) LCK-VN-transfected CHO cell labelled with VN-recognizing GFP antibodies and co-labelled for GM130. (C) BiFC assay with CHO cells co-transfected with LCK-VN and GAD65-VC proteins shown on the diagram. Immunolabelling for GAD65 was used for normalization. Graph shows mean ± SEM BiFC / GAD65 ratio. *p, one-way ANOVA and Dunnett’s multiple comparisons test (n = 15 cells per group). (D) BiFC fluorescence distribution in the XY confocal slice and ZX and ZY sections along the dashed lines through the 3D reconstructed GAD65WT-VC-co-transfected cell shown in C . Note PM localization of the BiFC signals in ZX and ZY sections. Arrowheads show vesicle-like structures at the PM. (E) CHO cells co-transfected with LCK-VN, GAD65WT-VC and either pcDNA3 or NEGR1. Cells were co-labelled for NEGR1. Arrows show clusters of NEGR1 co-localized with BiFC signals. (F) CHO cell co-transfected with LCK-VN and GAD65WT-VC co-labelled for clathrin. Arrowheads in ZX and ZY sections through the 3D reconstructed cell show BiFC signals co-localized with clathrin accumulations at the PM. (G) FM4-64 loaded vesicles in CHO cells co-transfected with GAD65-GFP and either pcDNA3 or NEGR1. High magnification images show areas outlined with dashed boxes. Arrows show examples of FM-loaded vesicles co-localized with GAD65-GFP. Graph shows mean ± SEM percentages of FM- loaded vesicles co-localized with GAD65-GFP and FM4-64 levels. *p, Mann-Whitney test (n = 42 cells per group). Bars, 20 µm (low magnification), 5 µm (high magnification) (B-G) .
Article Snippet:
Techniques: Transfection, Bimolecular Fluorescence Complementation Assay, Fluorescence, MANN-WHITNEY

Journal: bioRxiv
Article Title: Neuronal growth regulator 1 (NEGR1) promotes synaptic targeting of glutamic acid decarboxylase 65 (GAD65)
doi: 10.1101/2022.02.08.479601
Figure Lengend Snippet: (A, B) CHO cells transfected with pcDNA3 or NEGR1 were either co-transfected with mCherry-D4H to visualize cholesterol (A) or immunolabelled for ganglioside GM4 (B) . Bars, 20 µm. Graphs show ratios of D4H and GM4 labelling levels at the PM and in cytoplasm (mean + SEM, n = 20). *p, Mann Whitney test. (C) Lipid raft markers gangliosides GM4 and GD3 and phosphatidylinositol 4,5-bisphosphate (PIP2) analyzed in triplicate by dot blot in brain homogenates (BH) and synaptosomes (synapt.) from a representative pair of NEGR1+/+ and NEGR1-/- littermates. Graphs show mean + SEM synaptic enrichments of the lipids in NEGR1-/- mice relative to the levels in NEGR1+/+ mice set to 1. n = 5 pairs of NEGR1+/+ and NEGR1-/- mice were analyzed. *p, one sample t test vs +/+. Figure 6 source data. Contains dot blot source data for Figure 6.
Article Snippet:
Techniques: Transfection, MANN-WHITNEY, Dot Blot

Journal: bioRxiv
Article Title: Neuronal growth regulator 1 (NEGR1) promotes synaptic targeting of glutamic acid decarboxylase 65 (GAD65)
doi: 10.1101/2022.02.08.479601
Figure Lengend Snippet: ( A ) Neurites of NEGR1+/+ cultured hypothalamic neurons immunolabelled for NEGR1, GAD65 and NPY. Arrows show examples of NEGR1 clusters overlapping with NPY positive GAD65 accumulations. Open arrowheads show NPY negative GAD65 accumulations with lower levels of NEGR1. Bar, 5 µm. Graph shows mean ± SEM levels of NEGR1 in NPY positive (+) and negative (-) GAD65 accumulations (n > 100). AU – arbitrary units defined as pixel values of 16-bit gray scale images. *p, unpaired t test. ( B, C ) Confocal images of the ARC ( B ) and pyramidal cell layer in the hippocampal CA3 region ( C ) in brain sections of NEGR1+/+ and NEGR1-/- littermates immunolabelled for NEGR1, GAD65 and VGAT. Bar, 10 µm. Graphs show mean ± SEM densities of VGAT accumulations. *p, Mann-Whitney test.
Article Snippet:
Techniques: Cell Culture, MANN-WHITNEY

Journal: bioRxiv
Article Title: Neuronal growth regulator 1 (NEGR1) promotes synaptic targeting of glutamic acid decarboxylase 65 (GAD65)
doi: 10.1101/2022.02.08.479601
Figure Lengend Snippet: ( A ) Mean ± SEM percentages of pellets eaten over 30 min during magazine training sessions. One pellet was released into the magazine each minute. ( B ) Mean ± SEM numbers of active lever presses and pellets eaten during the fixed ratio task. Each active lever press led to the release of a pellet. ( C ) Individual progressive ratio break point values measured over three consecutive days in the progressive ratio task. Lines connect data for individual mice. Graphs showing data normalized to the values on day 1 set to 100% are included to illustrate an increase in the progressive ratio break point in NEGR1+/+ mice. ( D ) Mean ± SEM of the normalized values shown in C . ( E ) Mean ± SEM numbers of pellets delivered and active lever presses in the progressive ratio task. The numbers of active lever presses were normalized to the number on day 1 set to 100%. In A - E , n = 9 NEGR1+/+, 8 NEGR1+/- and 12 NEGR1-/- mice were analyzed. *p, repeated measures two-way ANOVA and Tukey’s multiple comparisons test.
Article Snippet:
Techniques:

Journal: bioRxiv
Article Title: Neuronal growth regulator 1 (NEGR1) promotes synaptic targeting of glutamic acid decarboxylase 65 (GAD65)
doi: 10.1101/2022.02.08.479601
Figure Lengend Snippet: (A-C) Western blot (WB) analysis of NEGR1 levels in homogenates (H), synaptosomes (S) and soluble protein fractions (sol) from brains of chow and high fat diet (HFD) fed mice. GAPDH served as loading control. Graphs show levels of full length NEGR1 in brain homogenates and synaptosomes ( B ) and soluble NEGR1 fragments in the soluble protein fraction ( C ) from HFD fed mice relative to the levels in chow diet fed mice set to 100%. n = 3 mice per group. ( D ) WB analysis of the soluble protein fractions from NEGR1+/+ and NEGR1-/- brains with NEGR1 antibodies. Note that the NEGR1 fragment is detected only in the NEGR1+/+ lane. The diagram shows the structure of NEGR1 consisting of three Ig-domains attached to the PM via a GPI anchor. The site recognized by the antibody used for Western blot analysis is marked with a square. ( E ) WB analysis of GAD65 levels in synaptic PM from chow and HFD fed mice. NCAM1 served as loading control. Graph shows levels in HFD membranes relative to chow control set to 100%. n = 3 mice per group. (F) Concentration of GABA in synaptosomes from the brains of chow and HFD fed mice (n = 10). (G) WB analysis of GAD65 levels in homogenates (H), synaptosomes (S) and soluble protein fractions (sol) from brains of chow and HFD fed mice. GAPDH and synaptophysin served as loading controls. Graphs show levels of GAD65 in brain homogenates and synaptosomes of HFD fed mice relative to the levels in chow fed mice set to 100%. n = 3 mice per group. (H) Axons and dendrites of NEGR1+/+ cultured hypothalamic neurons co-transfected with cherry and control pcDNA3 vector or NEGR1. Neurons were immunolabelled for synaptophysin and NEGR1. Note reduced numbers of synaptophysin puncta (arrows) along the axons and dendrites of NEGR1-overexpressing neurons. Bar, 5 µm. Graphs show synaptophysin labelling intensities along dendrites (n = 14 - 24) and axons (n = 31 - 43). Mean of control was set to 100%. In B, C, E-H , mean ± SEM values are shown. *p, one sample t test vs chow ( B, C, E, G ) or Mann Whitney test ( F, H ). Figure 10 source data. Contains uncropped Western blot source data for Figure 10.
Article Snippet:
Techniques: Western Blot, Control, Concentration Assay, Cell Culture, Transfection, Plasmid Preparation, MANN-WHITNEY

Journal: bioRxiv
Article Title: Neuronal growth regulator 1 (NEGR1) promotes synaptic targeting of glutamic acid decarboxylase 65 (GAD65)
doi: 10.1101/2022.02.08.479601
Figure Lengend Snippet: (A) Synaptic vesicle localized GAD65 uses glutamate to synthesize GABA, which is transported to the vesicle lumen by VGAT ( a ). GAD65 is de-palmitoylated and removed to the cytosol from refilled vesicles ( b ), which then fuse with the PM and release GABA. GAD65 released to the cytosol can travel to the Golgi in the neuronal cell body (red arrow, ) or attach to the PM in the synapse ( c ). Palmitoylation of GAD65 at the PM targets it to the NEGR1-containing cholesterol-enriched microdomains, which are anchored in synapses by NEGR1-containing adhesive bonds ( d ). NEGR1-dependent synaptic clustering of lipid rafts promotes ‘loading’ of palmitoylated GAD65 on the newly formed synaptic vesicles ( e ). This loading is facilitated by interactions between NEGR1 containing lipid rafts and components of synaptic vesicles constraining the retrieval of synaptic vesicle membranes. Synaptic recycling of vesicles and GAD65 is shown with black and pink arrows, respectively. (B) In NEGR1+/+ neurons, synaptic clustering of lipid rafts by trans-synaptic NEGR1-containing adhesive bonds promotes synaptic accumulation of GAD65. (C) In NEGR1-/- neurons, synaptic clustering of lipid rafts is reduced, synaptic targeting of GAD65 is inhibited, and non-synaptic GAD65 clusters are formed.
Article Snippet:
Techniques: Adhesive
Journal: Scientific Reports
Article Title: Single-nucleus transcriptomic profiling of the diaphragm during mechanical ventilation
doi: 10.1038/s41598-024-82530-4
Figure Lengend Snippet: Differentially expressed genes and Kyoto Encyclopedia of Genes and Genomes analysis. Volcano plots showing the top twenty up- or downregulated genes for each cell type. The red dots represent upregulated genes, and the blue dots represent downregulated genes. ( P value < 0.05, and |log2foldchange| > 0.58). Bubble plot indicating the top enriched pathways for each cell type based on KEGGpathway enrichment analysis of differentially expressed genes( www.kegg.jp/kegg/kegg1.html ). The sizes of the dots represent the number of genes included in each pathway. The colour gradient of dots represents the adjusted P values of each enriched pathway. The genes Pfkfb3 , Tbc1d1 and the insulin signaling pathway; Pdgfd and the PI3K-Akt signaling pathway; Cxcr2 and PLD, Rap1 signaling pathways; Ccl21 and chemical carcinogenesis-reactive oxygen species signaling pathway; Mef2c and the calcium signaling pathway; Negr1 and leukocyte transendothelial migration signaling pathway are labelled by the black and red bars in Panels a , b , c , d , e , and f .
Article Snippet: After the semidry blotting procedure (50 min, 90 V), the membrane was incubated for 1 h at room temperature (RT) in 5% BSA blocking solution, followed by overnight incubation on a shaker at 4 °C with primary antibodies against PFKFB3 (bs-3528R, Boster Biological Technology Co., Ltd., Wuhan, China), PDGFD (bs-24572R, Boster), CXCR2 (bs-1629R, Boster),
Techniques: Protein-Protein interactions, Migration

Journal: Scientific Reports
Article Title: Single-nucleus transcriptomic profiling of the diaphragm during mechanical ventilation
doi: 10.1038/s41598-024-82530-4
Figure Lengend Snippet: Protein-protein interaction network (PPI network).We constructed nine PPI networks displaying protein-protein interactions among the related genes. The nodes represent proteins, and the edges represent the interaction strength between two proteins. The proteins PFKFB3 ( a ), PDGFD ( b ), CXCR2 ( c ), CCL21 ( d ), SEMA3A ( e ), RYR3 ( f ), MEF2C ( g ), NEGR1( h ) and TBC1D1 ( i ) which are located at the hub of the interaction network, are responsible for diaphragm fibrosis and atrophy.
Article Snippet: After the semidry blotting procedure (50 min, 90 V), the membrane was incubated for 1 h at room temperature (RT) in 5% BSA blocking solution, followed by overnight incubation on a shaker at 4 °C with primary antibodies against PFKFB3 (bs-3528R, Boster Biological Technology Co., Ltd., Wuhan, China), PDGFD (bs-24572R, Boster), CXCR2 (bs-1629R, Boster),
Techniques: Construct, Protein-Protein interactions

Journal: Scientific Reports
Article Title: Single-nucleus transcriptomic profiling of the diaphragm during mechanical ventilation
doi: 10.1038/s41598-024-82530-4
Figure Lengend Snippet: Quantitative real-time polymerase chain reaction (qRT-PCR) and Western blotting. qRT-PCR and Western blotting showing the expression of selected genes and corresponding proteins in the mechanically ventilated diaphragm and control ones. The bar graphs show the quantification of the mRNA expression of Pfkfb3 ( a ), Pdgfd ( b ), Cxcr2 ( c ), Negr1 ( d ), Sema3a ( e ), and Mef2c ( f ) normalized to that of GAPDH. Asterisks indicate significant differences ( n = 3 in each group) (* P < 0.05). Western blotting analysis of the protein expression of PFKFB3 ( g ), PDGFD ( h ), CXCR2 ( i ), NEGR1 ( j ), SEMA3A ( k ), and MEF2C ( l ) normalized to that of β-actin as a loading control.
Article Snippet: After the semidry blotting procedure (50 min, 90 V), the membrane was incubated for 1 h at room temperature (RT) in 5% BSA blocking solution, followed by overnight incubation on a shaker at 4 °C with primary antibodies against PFKFB3 (bs-3528R, Boster Biological Technology Co., Ltd., Wuhan, China), PDGFD (bs-24572R, Boster), CXCR2 (bs-1629R, Boster),
Techniques: Real-time Polymerase Chain Reaction, Quantitative RT-PCR, Western Blot, Expressing, Control
Journal: bioRxiv
Article Title: Neuronal growth regulator 1 (NEGR1) promotes synaptic targeting of glutamic acid decarboxylase 65 (GAD65)
doi: 10.1101/2022.02.08.479601
Figure Lengend Snippet: (A) NEGR1+/+ cultured hypothalamic neuron immunolabelled for NEGR1, GAD65 and VGAT. Magnified images of the outlined areas show examples of NEGR1 clusters overlapping with GAD65 and VGAT accumulations (arrows). NEGR1-/- neurons were labelled for control. Bars, 10 µm. (B) NEGR1+/+ cultured hypothalamic neurons immunolabelled for a dendritic marker protein MAP2 and axonal marker protein tau. Bar, 20 µm. (C-F) Western blot (WB) analysis of VGAT ( C, D ) and GAD65 ( E, F ) in NEGR1+/+ and NEGR1-/- brain homogenates (H), synaptosomes (S) and soluble protein (sol) fractions. NEGR1 labelling was included in ( C ) to illustrate its enrichment in synaptosomes. Two different exposures of GAD65 labelling in ( E ) are shown to better illustrate a reduction in GAD65 levels in NEGR1-/- synaptosomes and soluble protein fractions. Labelling for GAPDH and Ponceau stain was used to control loading. Labelling for synaptophysin was used to confirm the efficiency of synaptosome isolation. Graphs show mean ± SEM changes in protein enrichment in NEGR1-/- synaptosomes and soluble protein fractions vs enrichment in NEGR1+/+ samples set to 1. n = 5 pairs of NEGR1+/+ and NEGR1-/- mice were analyzed. *p, one sample t test vs +/+. ( G ) NEGR1+/+ and NEGR1-/- cultured hypothalamic neurons immunolabeled for GAD65 and synaptophysin. ( H ) NEGR1-/- cultured hypothalamic neurons transfected with GAD65-GFP and pcDNA3 or NEGR1 immunolabelled for synaptophysin and NEGR1. In G , H , examples of synaptophysin positive (arrowheads) and negative (arrows) GAD65 clusters are shown. Bars, 5 µm. Graphs show cumulative frequency (CF) of neurons with different percentages of synaptophysin negative GAD65 clusters. *p, Mann-Whitney test (n = 20 ( G ) and 30 ( H ) neurons per group). Figure 1 source data. Contains uncropped Western blot source data for Figure 1.
Article Snippet:
Techniques: Cell Culture, Control, Marker, Western Blot, Staining, Isolation, Protein Enrichment, Immunolabeling, Transfection, MANN-WHITNEY
Journal: bioRxiv
Article Title: Neuronal growth regulator 1 (NEGR1) promotes synaptic targeting of glutamic acid decarboxylase 65 (GAD65)
doi: 10.1101/2022.02.08.479601
Figure Lengend Snippet: (A) NEGR1+/+ cultured hypothalamic neurons treated with recombinant soluble NEGR1 (sNEGR1) or mock-treated with the culture medium (control) immunolabeled for GAD65 and synaptophysin. Bar, 5 µm. Graph shows mean + SEM levels of GAD65 in synaptophysin accumulations relative to the mean value of the control set to 100% (n > 1000 boutons analyzed per group). *p, one-way ANOVA and Dunnett’s multiple comparisons test (compared to control). (B) Western blot (WB) analysis of GAD65 levels in homogenates (H), synaptosomes (S) and soluble protein fractions (sol) from hypothalamic tissues treated with BSA (control) or sNEGR1. GAPDH and synaptophysin served as loading controls. Graphs show mean ± SEM GAD65 levels in sNEGR1-treated tissues relative to GAD65 levels in the control set to 100% from n = 3 independent experiments. *p, one sample t test vs control. (C) Concentration of GABA in synaptosomes from hypothalamic tissues treated with BSA (control) or sNEGR1 (n = 7). *p, t test. Figure 2 source data. Contains uncropped Western blot source data for Figure 2.
Article Snippet:
Techniques: Cell Culture, Recombinant, Control, Immunolabeling, Western Blot, Concentration Assay
Journal: bioRxiv
Article Title: Neuronal growth regulator 1 (NEGR1) promotes synaptic targeting of glutamic acid decarboxylase 65 (GAD65)
doi: 10.1101/2022.02.08.479601
Figure Lengend Snippet: (A-D) Synaptic vesicles in cultured hypothalamic neurons were loaded with FM4-64 applied for 2 min in 47 mM K+ buffer (0 s). Time lapse images show release of the dye in response to the electric field stimulation. Bar, 5 μm. Graphs show FM4-64 uptake at 0 s, changes in FM4-64 levels (ΔF/F) in synaptic boutons over time during the stimulation, and half-life of FM4-64 loss during the stimulation (mean ± SEM, *p, Mann-Whitney test). (A) NEGR1+/+ neurons (n = 113 boutons from 10 neurons) and NEGR1-/- neurons (n = 108 boutons from 10 neurons). (B, C) NEGR1+/+ neurons co-transfected with GFP and pcDNA3 or NEGR1. Axons ( B, n = 418 boutons from 10 pcDNA3-transfected neurons, 266 boutons from 12 NEGR1-transfected neurons) and dendrites ( C , n = 376 boutons from 12 pcDNA3-transfected neurons, 261 boutons from 13 NEGR1- transfected neurons). (D) NEGR1+/+ neurons treated with control non-specific immunoglobulins (Ig, n = 681 boutons from 10 neurons) or NEGR1 antibodies (NEGR1 Ab, n = 514 boutons from 10 neurons).
Article Snippet:
Techniques: Cell Culture, MANN-WHITNEY, Transfection, Control
Journal: bioRxiv
Article Title: Neuronal growth regulator 1 (NEGR1) promotes synaptic targeting of glutamic acid decarboxylase 65 (GAD65)
doi: 10.1101/2022.02.08.479601
Figure Lengend Snippet: (A, B) NEGR1+/+ cultured hypothalamic neurons treated with sNEGR1 and dynasore ( A ) or TetTx ( B ) as indicated. Control neurons were mock treated with vehicle (DMSO in A , water in B ). Neurons were immunolabeled for GAD65 and synaptophysin. Examples of synaptophysin positive (arrows) and negative (arrowheads) GAD65 clusters are shown. Bars, 5 µm. Graphs show cumulative frequency (CF) of neurons with increasing percentages of synaptophysin negative GAD65 clusters. *p, Mann-Whitney test (n = 20-26 neurons per group). (C, D) sNEGR1-treated and control culture medium-treated NEGR1+/+ cultured hypothalamic neurons incubated live with antibodies against the lumenal domain of VGAT. The antibodies were detected with secondary antibodies applied before (VGAT surface_remaining ) and after (VGAT surface_delivered ) permeabilization of membranes with detergent. Neurons were co-labelled with antibodies against the cytoplasmic domain of VGAT (VGAT synaptic ). Bar, 5 μm. Graphs show mean + SEM labelling intensities of VGAT synaptic and VGAT surface_delivered ( C ), VGAT surface_remaining ( D ), and their ratios (n = 40 neurons in C , 20 neurons in D ). Control mean intensity was set to 100%. (E) Western blot analysis of GAD65 levels in synaptic PM from hypothalamic tissues treated with BSA or sNEGR1 applied either alone (cont.) or together with dynasore (dyn.) or TetTx. NCAM1 served as loading control. Graph shows mean ± SEM GAD65 levels relative to the levels in BSA only treated tissues set to 100% from n = 3 independent experiments. Samples from each experiment were analyzed by Western blot twice and the data were averaged. *p, one sample t test vs BSA only treated tissues. Figure 4 source data. Contains uncropped Western blot source data for Figure 4.
Article Snippet:
Techniques: Cell Culture, Control, Immunolabeling, MANN-WHITNEY, Incubation, Western Blot
Journal: bioRxiv
Article Title: Neuronal growth regulator 1 (NEGR1) promotes synaptic targeting of glutamic acid decarboxylase 65 (GAD65)
doi: 10.1101/2022.02.08.479601
Figure Lengend Snippet: (A) Diagram illustrating the principle of detection of the PM attachment of GAD65 using BiFC. (B) LCK-VN-transfected CHO cell labelled with VN-recognizing GFP antibodies and co-labelled for GM130. (C) BiFC assay with CHO cells co-transfected with LCK-VN and GAD65-VC proteins shown on the diagram. Immunolabelling for GAD65 was used for normalization. Graph shows mean ± SEM BiFC / GAD65 ratio. *p, one-way ANOVA and Dunnett’s multiple comparisons test (n = 15 cells per group). (D) BiFC fluorescence distribution in the XY confocal slice and ZX and ZY sections along the dashed lines through the 3D reconstructed GAD65WT-VC-co-transfected cell shown in C . Note PM localization of the BiFC signals in ZX and ZY sections. Arrowheads show vesicle-like structures at the PM. (E) CHO cells co-transfected with LCK-VN, GAD65WT-VC and either pcDNA3 or NEGR1. Cells were co-labelled for NEGR1. Arrows show clusters of NEGR1 co-localized with BiFC signals. (F) CHO cell co-transfected with LCK-VN and GAD65WT-VC co-labelled for clathrin. Arrowheads in ZX and ZY sections through the 3D reconstructed cell show BiFC signals co-localized with clathrin accumulations at the PM. (G) FM4-64 loaded vesicles in CHO cells co-transfected with GAD65-GFP and either pcDNA3 or NEGR1. High magnification images show areas outlined with dashed boxes. Arrows show examples of FM-loaded vesicles co-localized with GAD65-GFP. Graph shows mean ± SEM percentages of FM- loaded vesicles co-localized with GAD65-GFP and FM4-64 levels. *p, Mann-Whitney test (n = 42 cells per group). Bars, 20 µm (low magnification), 5 µm (high magnification) (B-G) .
Article Snippet:
Techniques: Transfection, Bimolecular Fluorescence Complementation Assay, Fluorescence, MANN-WHITNEY
Journal: bioRxiv
Article Title: Neuronal growth regulator 1 (NEGR1) promotes synaptic targeting of glutamic acid decarboxylase 65 (GAD65)
doi: 10.1101/2022.02.08.479601
Figure Lengend Snippet: (A, B) CHO cells transfected with pcDNA3 or NEGR1 were either co-transfected with mCherry-D4H to visualize cholesterol (A) or immunolabelled for ganglioside GM4 (B) . Bars, 20 µm. Graphs show ratios of D4H and GM4 labelling levels at the PM and in cytoplasm (mean + SEM, n = 20). *p, Mann Whitney test. (C) Lipid raft markers gangliosides GM4 and GD3 and phosphatidylinositol 4,5-bisphosphate (PIP2) analyzed in triplicate by dot blot in brain homogenates (BH) and synaptosomes (synapt.) from a representative pair of NEGR1+/+ and NEGR1-/- littermates. Graphs show mean + SEM synaptic enrichments of the lipids in NEGR1-/- mice relative to the levels in NEGR1+/+ mice set to 1. n = 5 pairs of NEGR1+/+ and NEGR1-/- mice were analyzed. *p, one sample t test vs +/+. Figure 6 source data. Contains dot blot source data for Figure 6.
Article Snippet:
Techniques: Transfection, MANN-WHITNEY, Dot Blot
Journal: bioRxiv
Article Title: Neuronal growth regulator 1 (NEGR1) promotes synaptic targeting of glutamic acid decarboxylase 65 (GAD65)
doi: 10.1101/2022.02.08.479601
Figure Lengend Snippet: ( A ) Neurites of NEGR1+/+ cultured hypothalamic neurons immunolabelled for NEGR1, GAD65 and NPY. Arrows show examples of NEGR1 clusters overlapping with NPY positive GAD65 accumulations. Open arrowheads show NPY negative GAD65 accumulations with lower levels of NEGR1. Bar, 5 µm. Graph shows mean ± SEM levels of NEGR1 in NPY positive (+) and negative (-) GAD65 accumulations (n > 100). AU – arbitrary units defined as pixel values of 16-bit gray scale images. *p, unpaired t test. ( B, C ) Confocal images of the ARC ( B ) and pyramidal cell layer in the hippocampal CA3 region ( C ) in brain sections of NEGR1+/+ and NEGR1-/- littermates immunolabelled for NEGR1, GAD65 and VGAT. Bar, 10 µm. Graphs show mean ± SEM densities of VGAT accumulations. *p, Mann-Whitney test.
Article Snippet:
Techniques: Cell Culture, MANN-WHITNEY
Journal: bioRxiv
Article Title: Neuronal growth regulator 1 (NEGR1) promotes synaptic targeting of glutamic acid decarboxylase 65 (GAD65)
doi: 10.1101/2022.02.08.479601
Figure Lengend Snippet: ( A ) Mean ± SEM percentages of pellets eaten over 30 min during magazine training sessions. One pellet was released into the magazine each minute. ( B ) Mean ± SEM numbers of active lever presses and pellets eaten during the fixed ratio task. Each active lever press led to the release of a pellet. ( C ) Individual progressive ratio break point values measured over three consecutive days in the progressive ratio task. Lines connect data for individual mice. Graphs showing data normalized to the values on day 1 set to 100% are included to illustrate an increase in the progressive ratio break point in NEGR1+/+ mice. ( D ) Mean ± SEM of the normalized values shown in C . ( E ) Mean ± SEM numbers of pellets delivered and active lever presses in the progressive ratio task. The numbers of active lever presses were normalized to the number on day 1 set to 100%. In A - E , n = 9 NEGR1+/+, 8 NEGR1+/- and 12 NEGR1-/- mice were analyzed. *p, repeated measures two-way ANOVA and Tukey’s multiple comparisons test.
Article Snippet:
Techniques:
Journal: bioRxiv
Article Title: Neuronal growth regulator 1 (NEGR1) promotes synaptic targeting of glutamic acid decarboxylase 65 (GAD65)
doi: 10.1101/2022.02.08.479601
Figure Lengend Snippet: (A-C) Western blot (WB) analysis of NEGR1 levels in homogenates (H), synaptosomes (S) and soluble protein fractions (sol) from brains of chow and high fat diet (HFD) fed mice. GAPDH served as loading control. Graphs show levels of full length NEGR1 in brain homogenates and synaptosomes ( B ) and soluble NEGR1 fragments in the soluble protein fraction ( C ) from HFD fed mice relative to the levels in chow diet fed mice set to 100%. n = 3 mice per group. ( D ) WB analysis of the soluble protein fractions from NEGR1+/+ and NEGR1-/- brains with NEGR1 antibodies. Note that the NEGR1 fragment is detected only in the NEGR1+/+ lane. The diagram shows the structure of NEGR1 consisting of three Ig-domains attached to the PM via a GPI anchor. The site recognized by the antibody used for Western blot analysis is marked with a square. ( E ) WB analysis of GAD65 levels in synaptic PM from chow and HFD fed mice. NCAM1 served as loading control. Graph shows levels in HFD membranes relative to chow control set to 100%. n = 3 mice per group. (F) Concentration of GABA in synaptosomes from the brains of chow and HFD fed mice (n = 10). (G) WB analysis of GAD65 levels in homogenates (H), synaptosomes (S) and soluble protein fractions (sol) from brains of chow and HFD fed mice. GAPDH and synaptophysin served as loading controls. Graphs show levels of GAD65 in brain homogenates and synaptosomes of HFD fed mice relative to the levels in chow fed mice set to 100%. n = 3 mice per group. (H) Axons and dendrites of NEGR1+/+ cultured hypothalamic neurons co-transfected with cherry and control pcDNA3 vector or NEGR1. Neurons were immunolabelled for synaptophysin and NEGR1. Note reduced numbers of synaptophysin puncta (arrows) along the axons and dendrites of NEGR1-overexpressing neurons. Bar, 5 µm. Graphs show synaptophysin labelling intensities along dendrites (n = 14 - 24) and axons (n = 31 - 43). Mean of control was set to 100%. In B, C, E-H , mean ± SEM values are shown. *p, one sample t test vs chow ( B, C, E, G ) or Mann Whitney test ( F, H ). Figure 10 source data. Contains uncropped Western blot source data for Figure 10.
Article Snippet:
Techniques: Western Blot, Control, Concentration Assay, Cell Culture, Transfection, Plasmid Preparation, MANN-WHITNEY
Journal: bioRxiv
Article Title: Neuronal growth regulator 1 (NEGR1) promotes synaptic targeting of glutamic acid decarboxylase 65 (GAD65)
doi: 10.1101/2022.02.08.479601
Figure Lengend Snippet: (A) Synaptic vesicle localized GAD65 uses glutamate to synthesize GABA, which is transported to the vesicle lumen by VGAT ( a ). GAD65 is de-palmitoylated and removed to the cytosol from refilled vesicles ( b ), which then fuse with the PM and release GABA. GAD65 released to the cytosol can travel to the Golgi in the neuronal cell body (red arrow, ) or attach to the PM in the synapse ( c ). Palmitoylation of GAD65 at the PM targets it to the NEGR1-containing cholesterol-enriched microdomains, which are anchored in synapses by NEGR1-containing adhesive bonds ( d ). NEGR1-dependent synaptic clustering of lipid rafts promotes ‘loading’ of palmitoylated GAD65 on the newly formed synaptic vesicles ( e ). This loading is facilitated by interactions between NEGR1 containing lipid rafts and components of synaptic vesicles constraining the retrieval of synaptic vesicle membranes. Synaptic recycling of vesicles and GAD65 is shown with black and pink arrows, respectively. (B) In NEGR1+/+ neurons, synaptic clustering of lipid rafts by trans-synaptic NEGR1-containing adhesive bonds promotes synaptic accumulation of GAD65. (C) In NEGR1-/- neurons, synaptic clustering of lipid rafts is reduced, synaptic targeting of GAD65 is inhibited, and non-synaptic GAD65 clusters are formed.
Article Snippet:
Techniques: Adhesive